Making network management accessible to non-technical operators
More than 2.5 billion people worldwide still lack access to the internet, limiting opportunities for economic and social development. In least developed countries, a 10% increased in school connectivity can translate up to 0.6% more effective years of schooling and a 1.1% increase in GDP per capita, according to the World Economic Forum.
Ukama aims to help close this digital divide by making it possible for anyone to own and operate their own network. Upon joining the team, my open-ended goal was to simplify network operations. I then helped shape the product strategy, lead the design, and deliver a network management system (NMS) to enable last-mile connectivity.
- Timeline
- 6 months
- Role
- Lead Product Designer
- Team
- 2 engineers, 1 CEO
- Tools
- Figma
Problem
Operators need a reliable way to understand network health.
One operator in DRC pinged his router every five minutes to make sure it was still online. Without accessible and affordable network monitoring, even basic visibility required sustained manual effort.
Traditional solutions require technical knowledge and training.
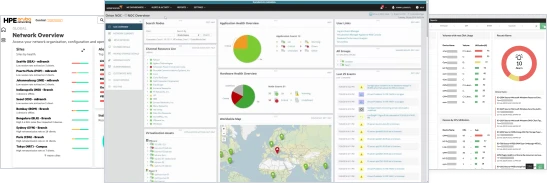
Traditional NMS tools expose a lot of technical detail, which poses issues for the untrained individual. Understanding what was wrong and where to look could be just as challenging as actually fixing the problem.
Solution
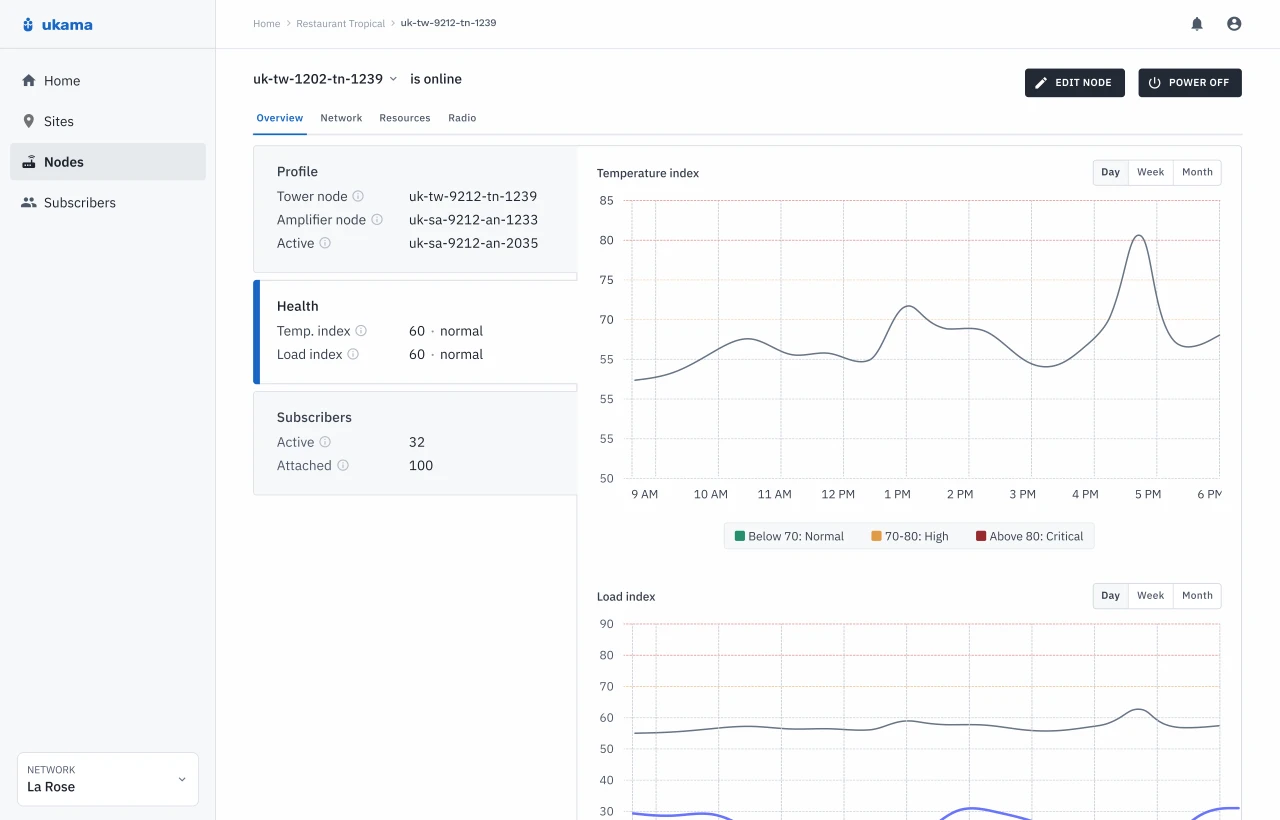
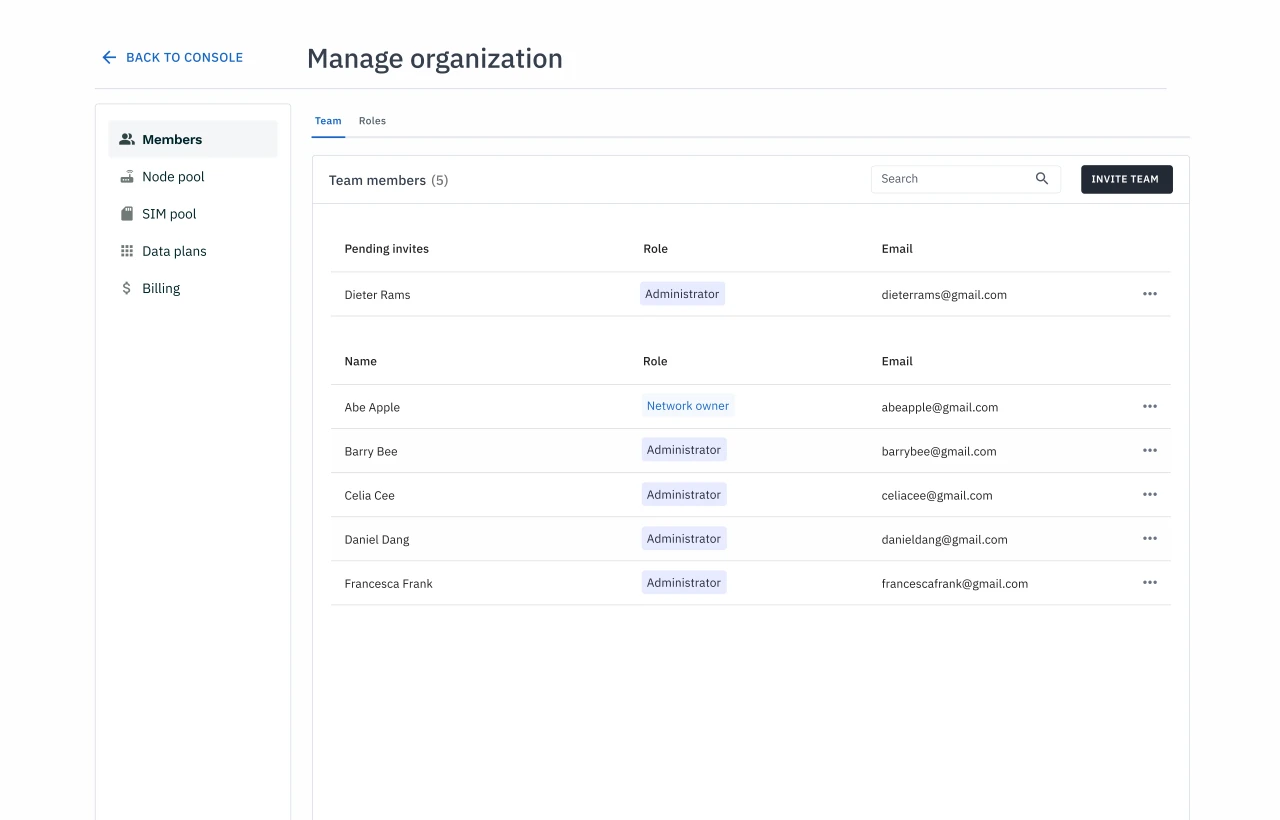
Outcomes
Task resolution TIME-15%
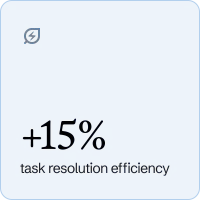
In internal testing, users were able to pinpoint network errors faster than using previous solutions.
QA iterations↓ 21%
I advocated for better documentation within the team, which lead to better developer hand-off experiences, and less bugs!
Sites SCOPED10+
I helped plan and lay the groundwork for pilot sites in partnership with USAID/USTDA in the FSM and DRC, gearing us up for global expansion.
Process
Before designing the interface, I needed to understand the broader ecosystem.
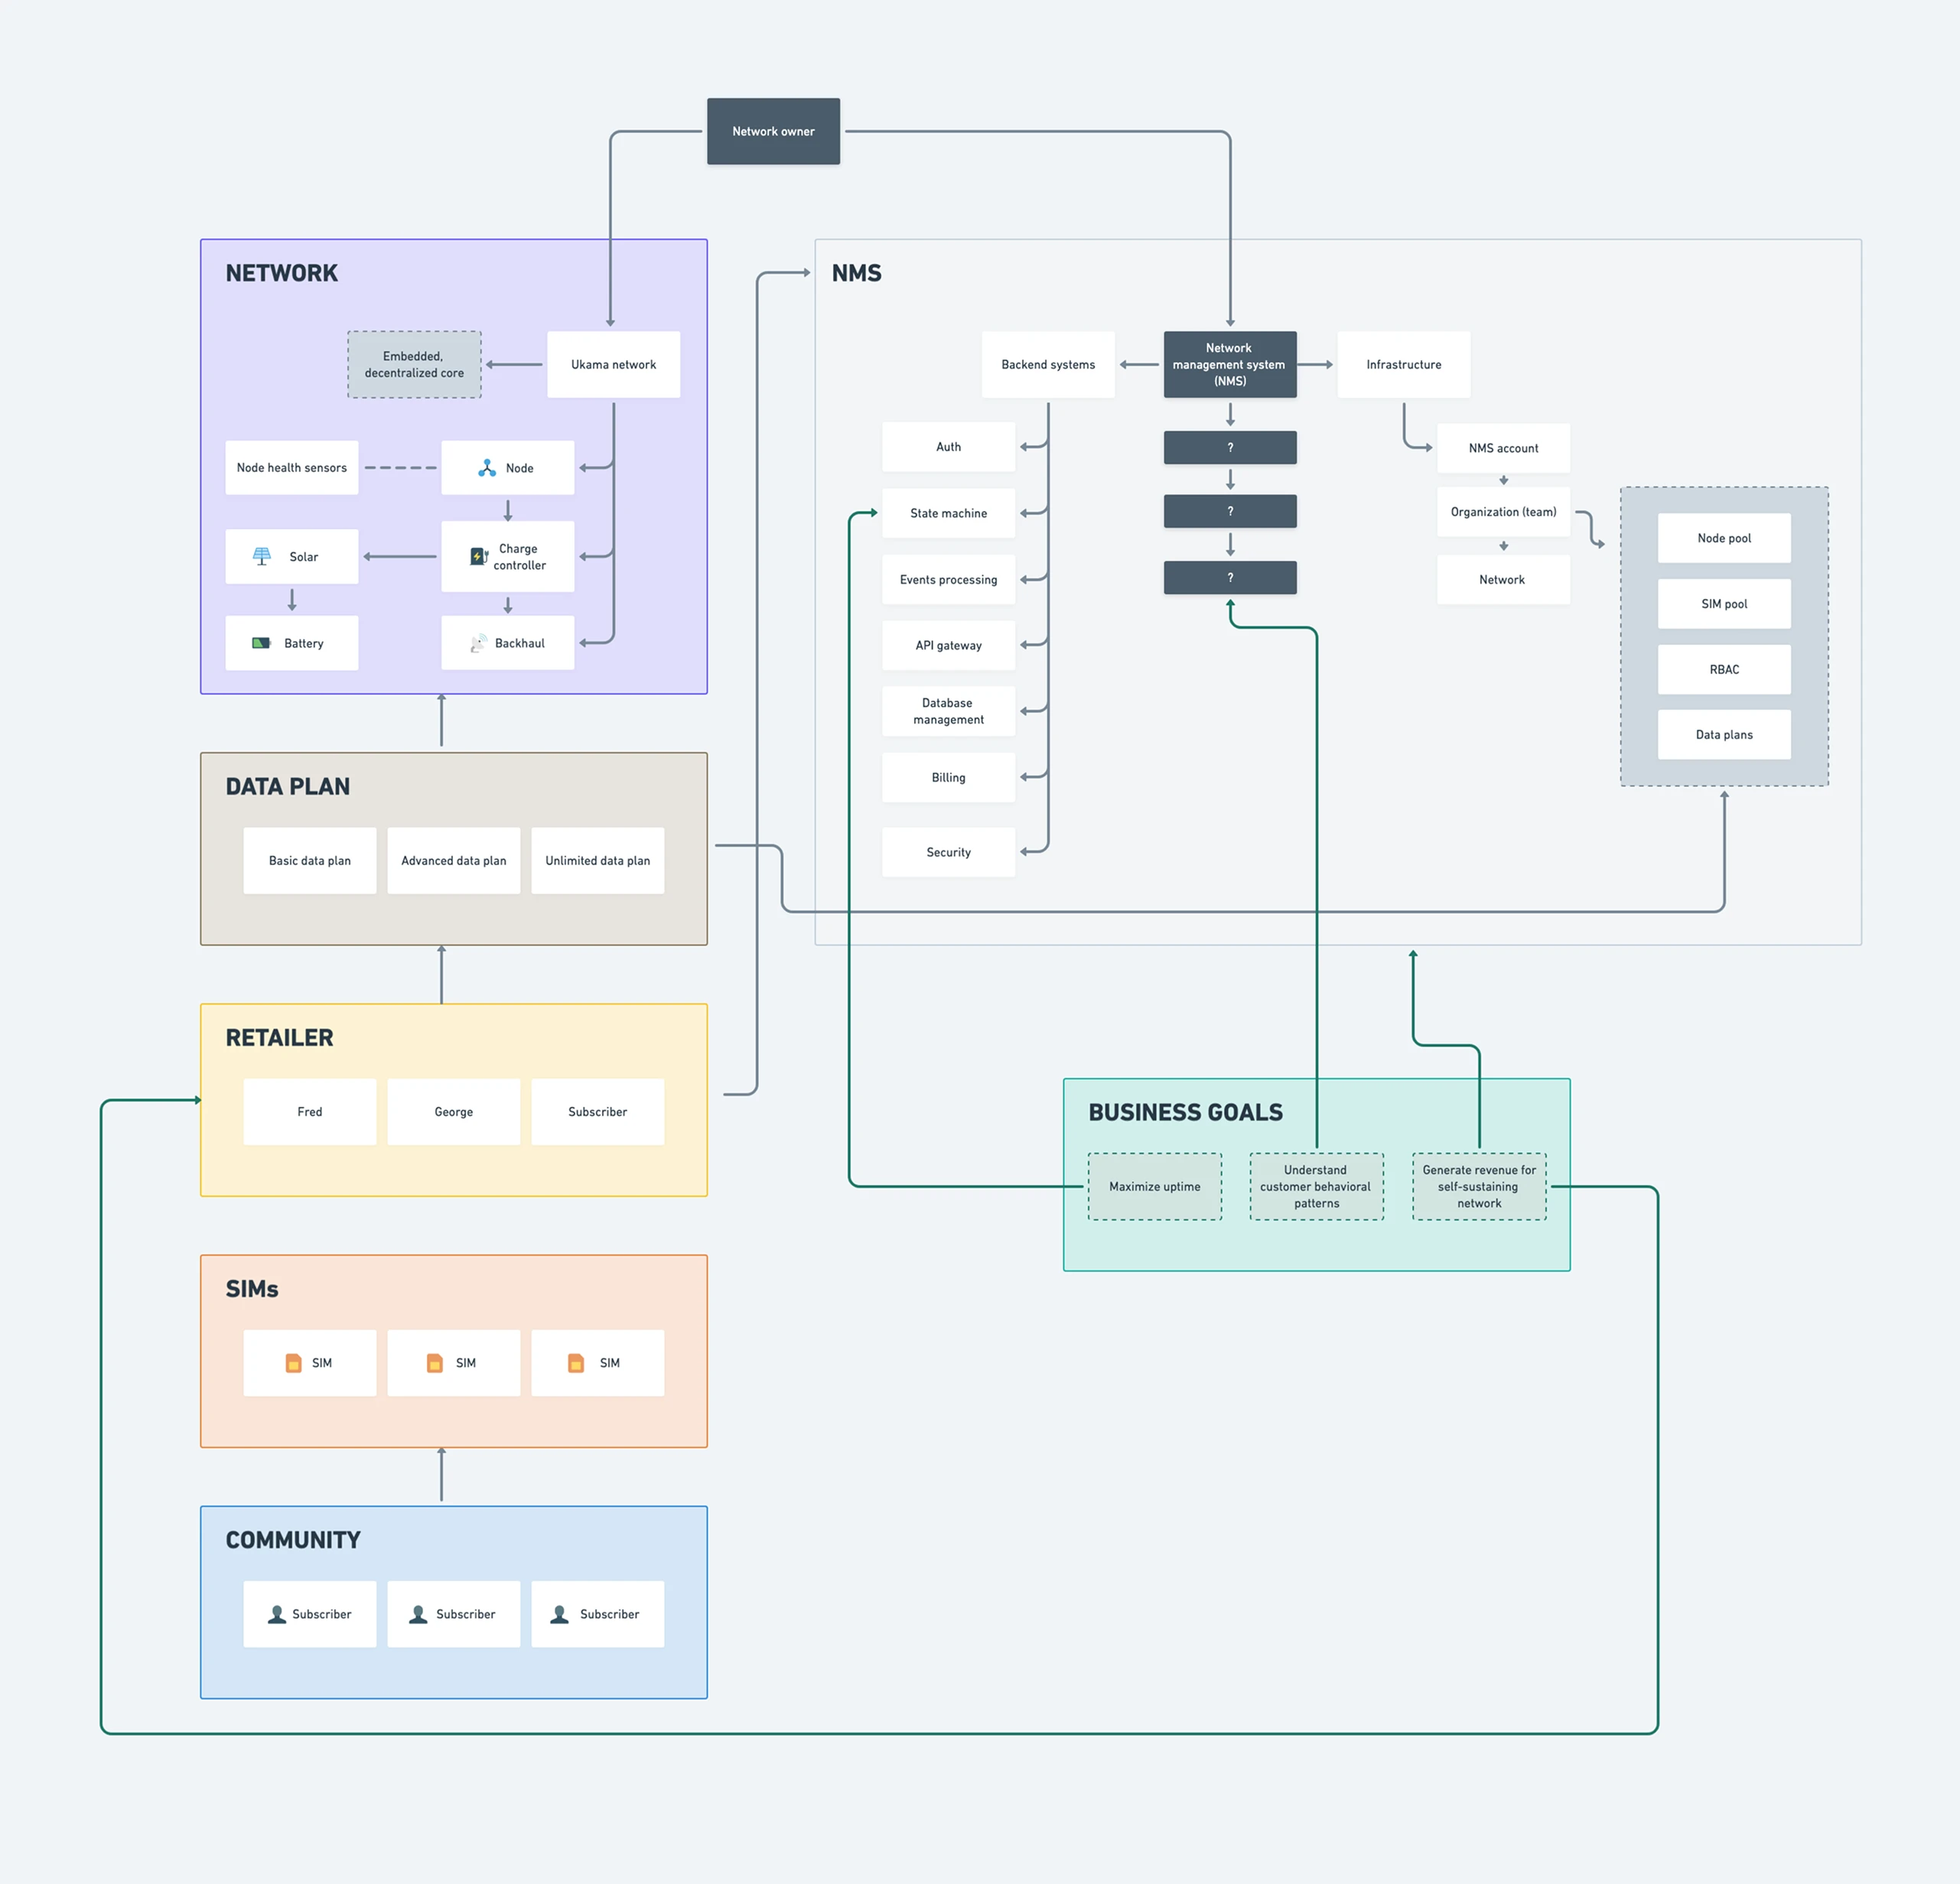
Joining the team with little domain knowledge, I started by understanding the broader ecosystem Ukama was building for. I spoke with prospective customers, studied existing solutions, and examined how Ukama’s business model with would in practice. This helped me understand not just what the NMS needed to do, but also the operational and commercial realities it needed to account for.
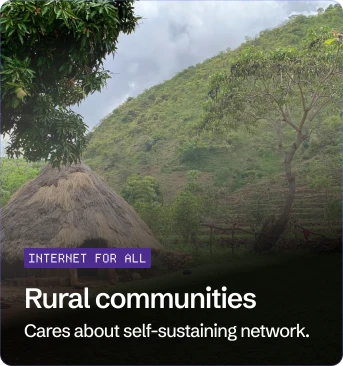
With customers ranging from rural entrepreneurs to large enterprises, who were we actually solving for?
Our initial product tiers were based on the hardware we planned to manufacture: outdoor tower nodes and indoor home nodes. Customer conversations showed this wasn’t a meaningful way to segment our customers. An enterprise might want a tower node to establish a private network, while a rural entrepreneur might use the same hardware to bring connectivity to an underserved community.
I advocated for restructuring our product segmentation around three distinct customer groups: Consumer, Enterprise, and Internet for All, and jammed with leadership to redefine each tier’s offerings. This gave us a more meaningful way to understand each group’s needs, operating models, and expectations. It also helped us prioritize the segment most closely aligned with our existing hardware and company mission: Internet for All.


What does a network operator actually need to know?
Through 10 interviews with prospective customers and adjacent experts, I explored how operators managed their networks and what they needed most.
One operator in the DRC pinged his router every five minutes to make sure it was still online because to him, making sure the network was online was the most important thing to know. Others mentioned checking up on which end users were impacted by outages, or what specific pieces of equipment were working or not working.
How could we translate the physical network into an interface operators could understand?
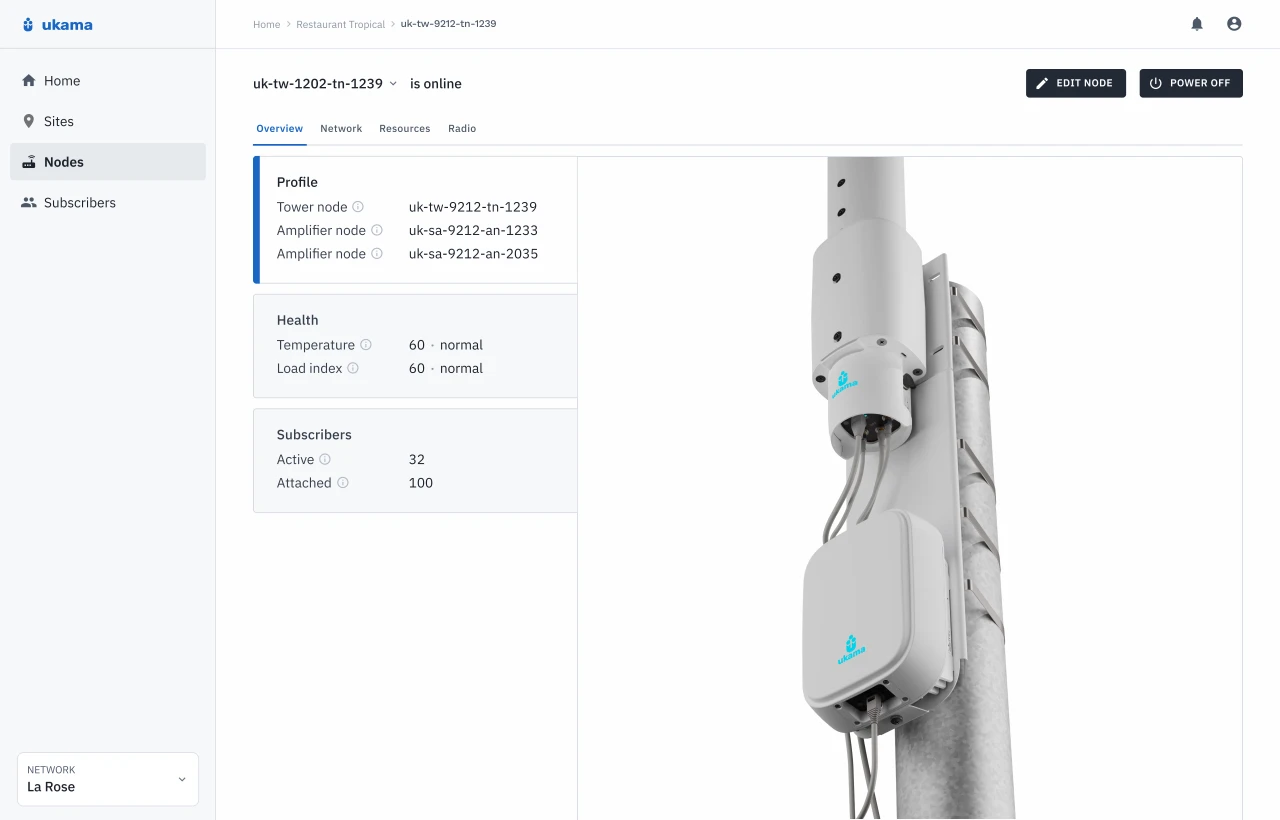
Uklama’s hardware separated cellular processing from the RF components responsible for transmitting and amplifying signals. I saw an opportunity to carry this modular architecture into the NMS: organizing the software around the physical components and relationships that make up the network.
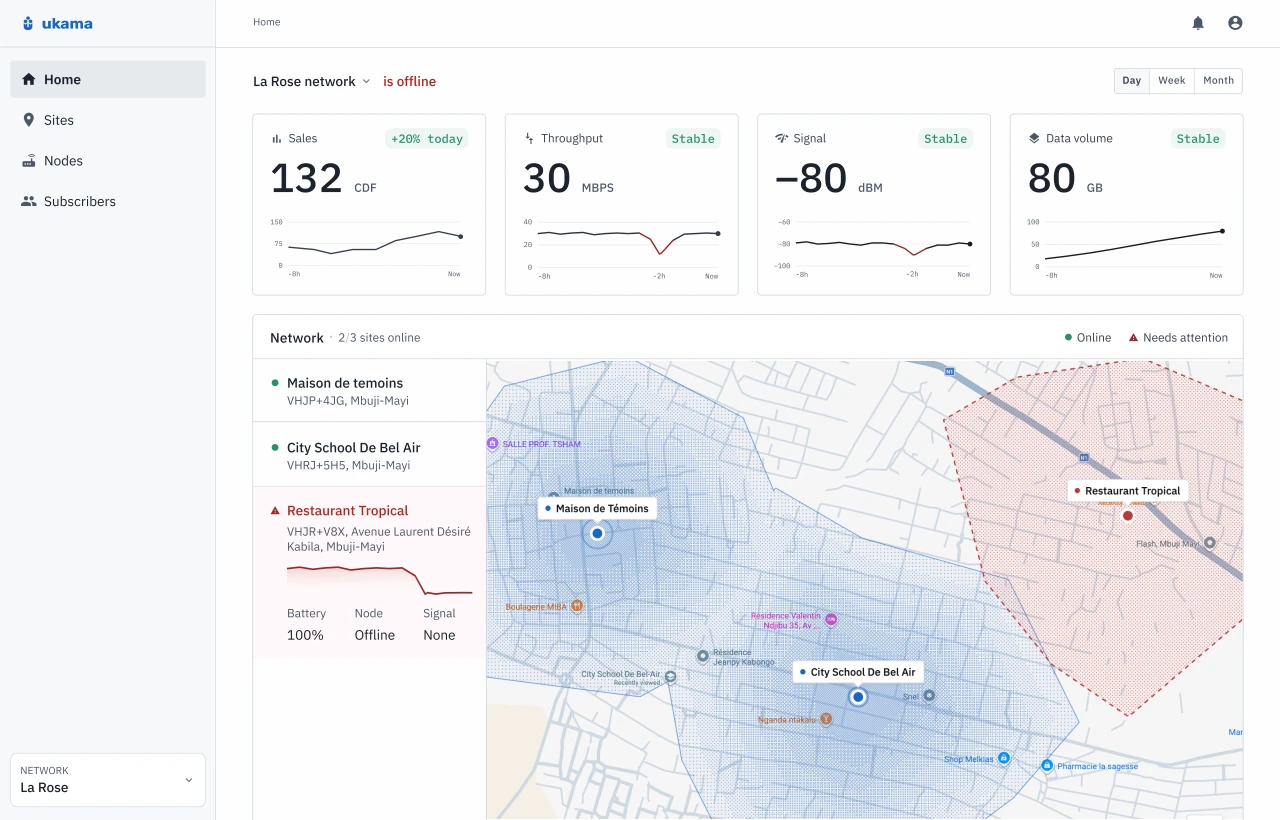
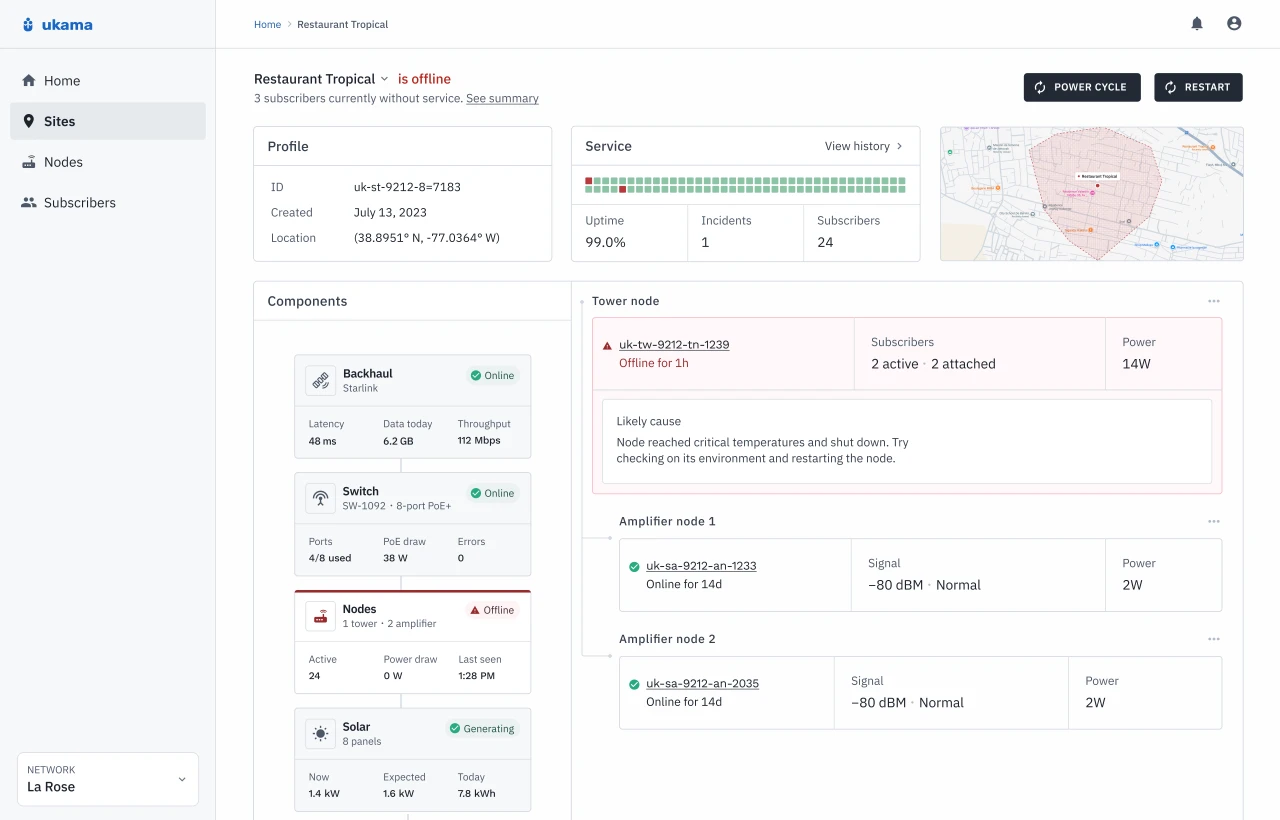
I mapped the relationship between networks, sites, nodes, and their supporting infrastructure to create a hierarchy that operators could navigate intuitively. This gave them a way to get a birds-eye view of their network health, and progressively narrow down to individual components if needed.
Do we need “sites” if most users start with just one?
Most new networks consisted of a single site: a physical location containing the node, backhaul, power, and other supporting infrastructure. This raised a question: would having another layer of abstraction make the experience unnecessarily complicated?
I advocated for retaining the concept of sites for two reasons:
- Room to grow: As networks expand, operators need a way to organize and manage multiple physical locations.
- A more complete picture: Sites provide a way to monitor the supporting infrastructure surrounding each node, rather than treating connectivity as an isolated component.
This decision set up a proper infrastructure for network monitoring and accommodate future growth.
With larger systemic decisions settled, I began exploring concepts for the homepage; the most important screen operators will interface with 99% of the time.
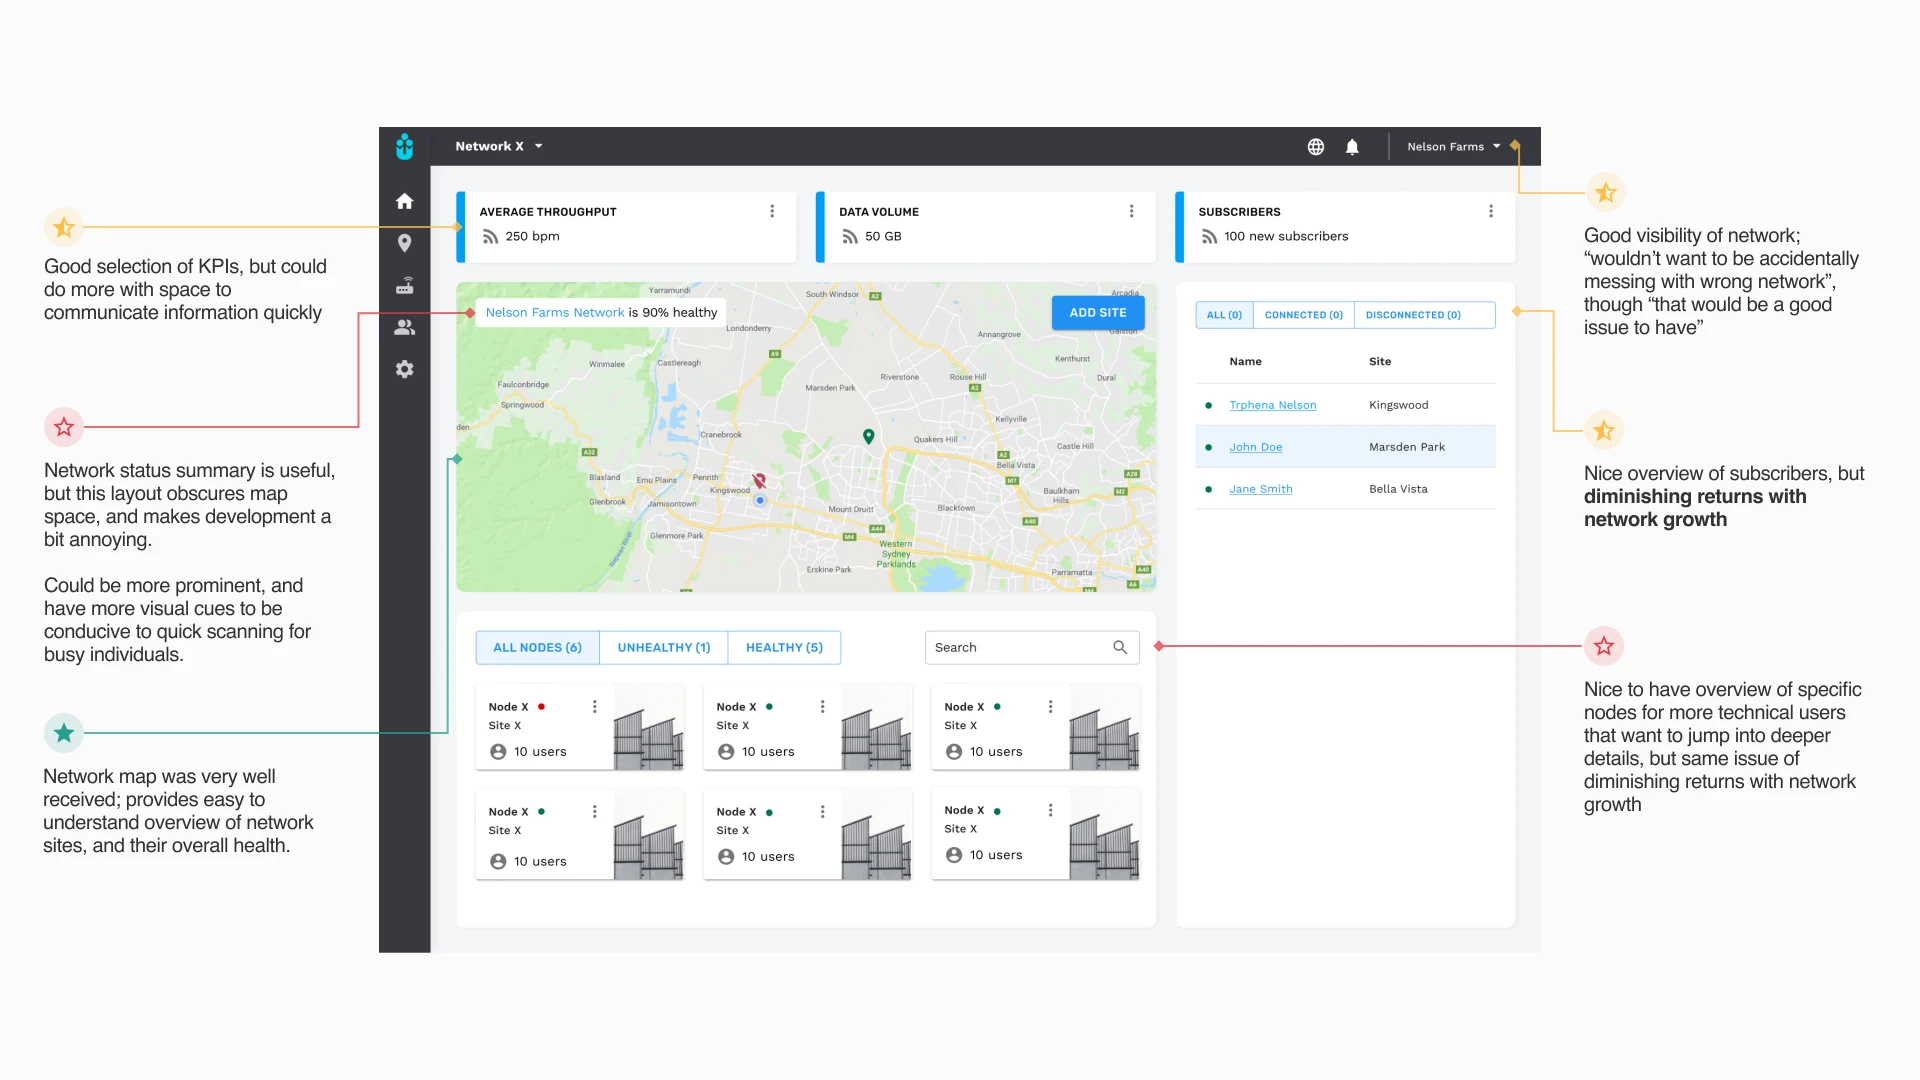
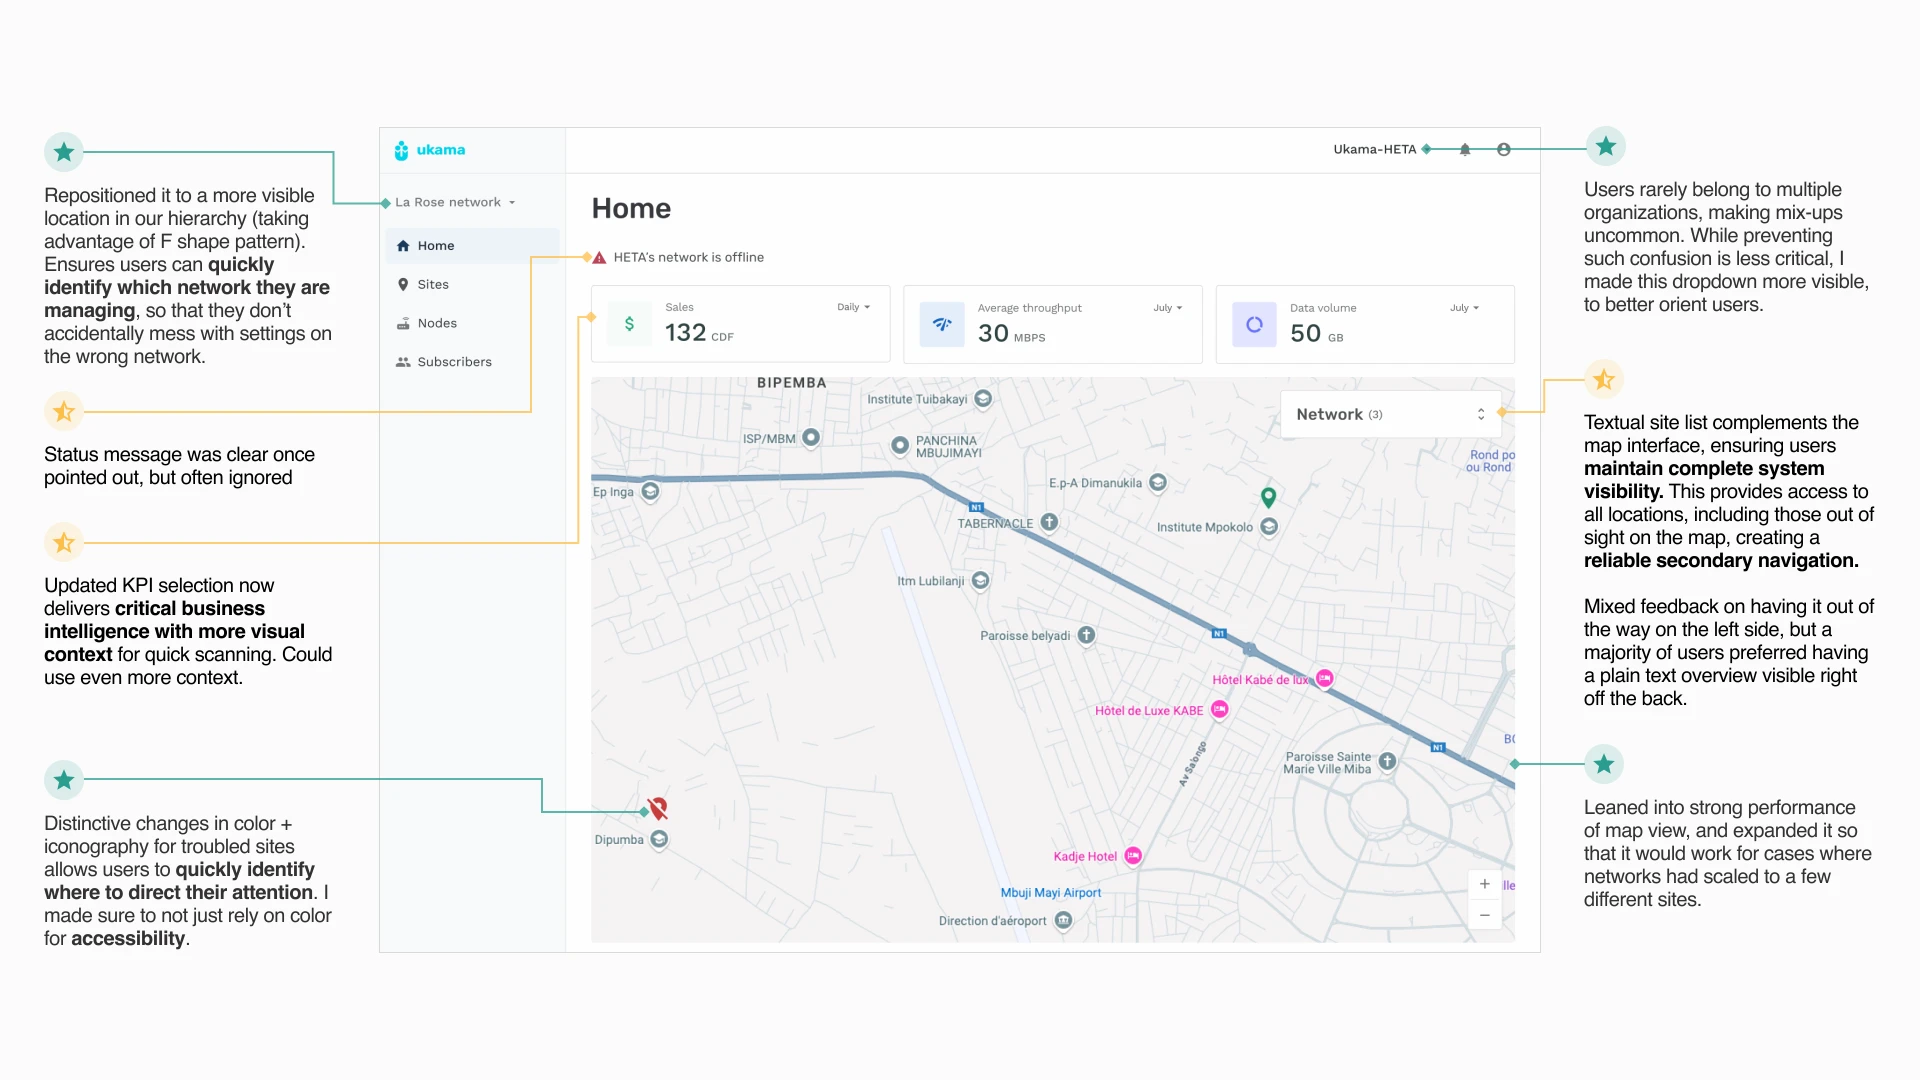
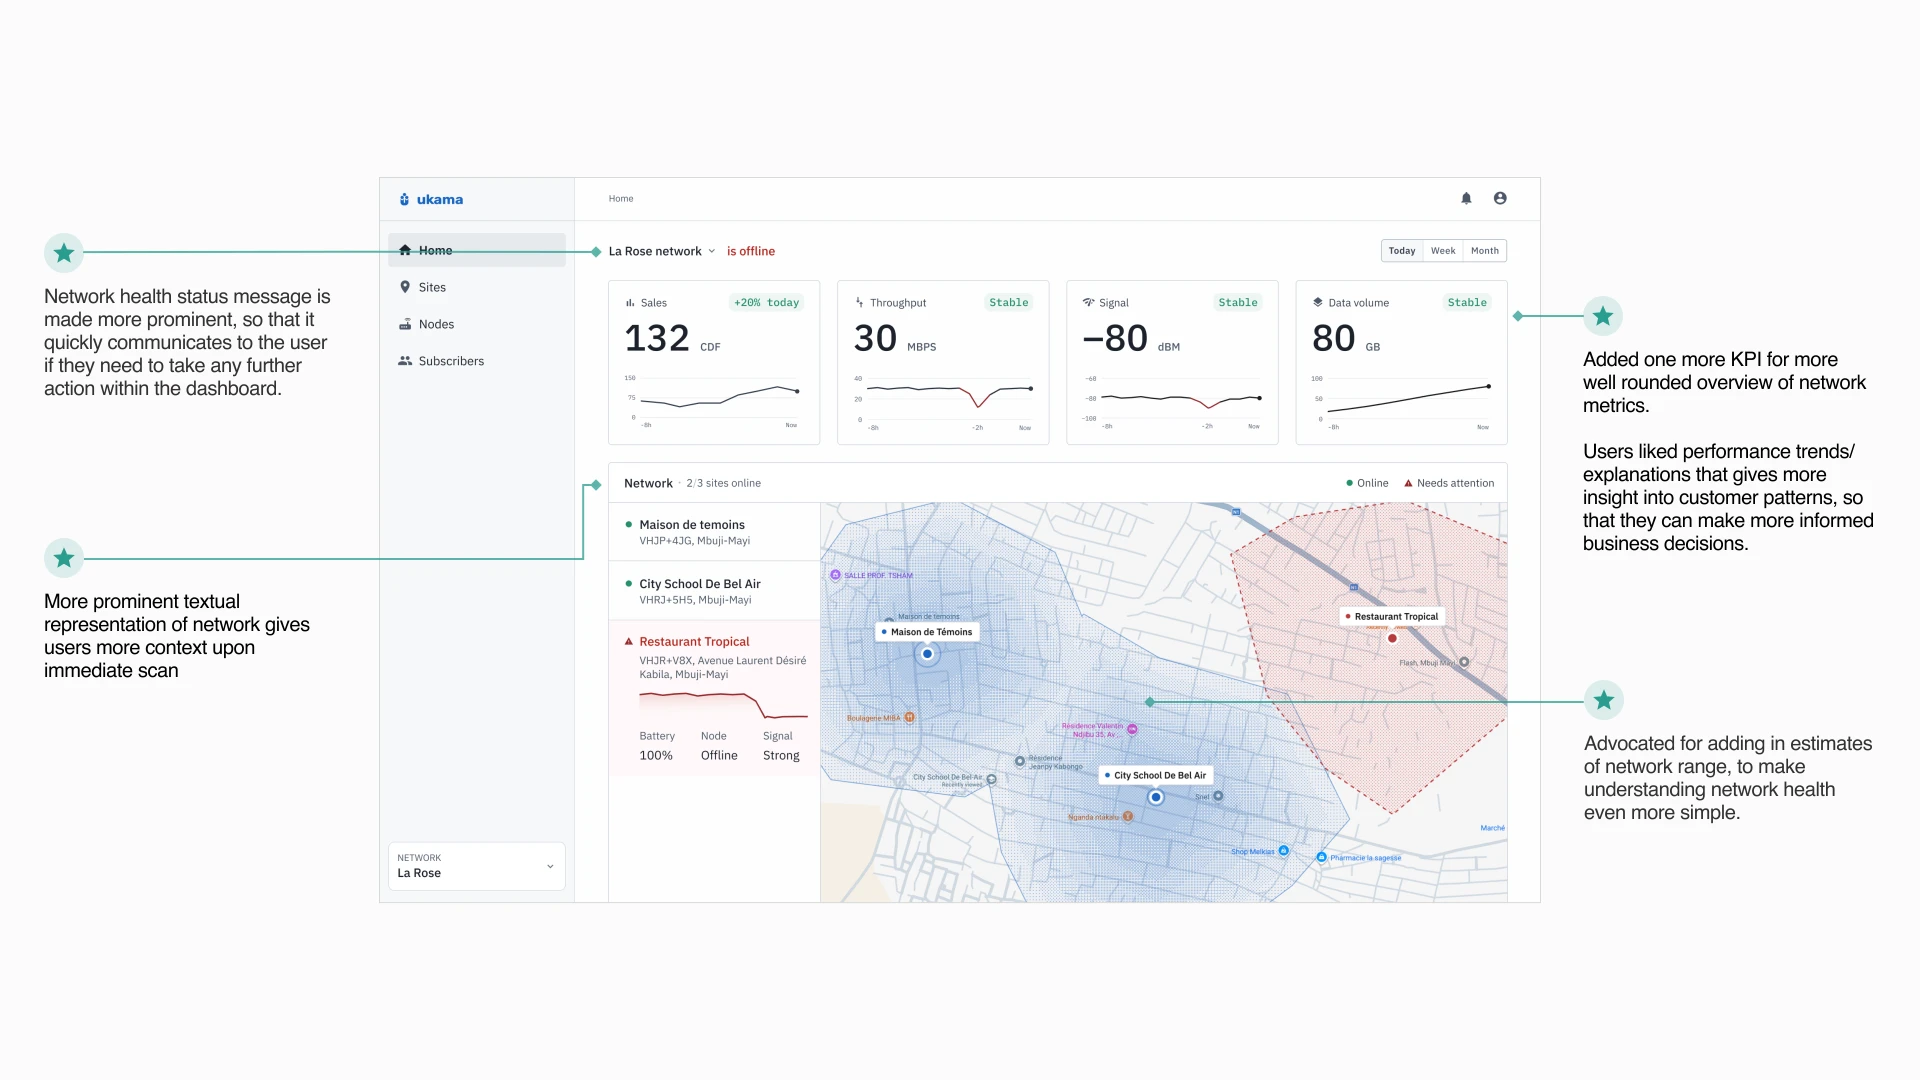
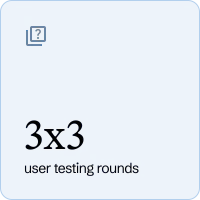
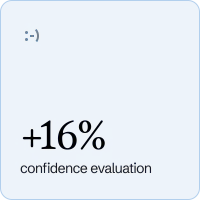
To test my hypothesis with limited resources, I conducted 3x3 rounds of user testing. We found task resolution efficiency increased by 15%.
I wanted to validate whether the proposed information architecture helped users complete real tasks, rather than simply making the interface appear easier to understand. I chose think-aloud exercises to see not only where participants struggled, but also what assumptions they were making throughout.
How could we support different operator needs without bloating the core experience?
As I continued speaking with prospective partners, I uncovered very niche, additional needs that weren’t fully addressed by the initial product. While I wanted to meet the needs of future customers to prime us for growth, I also did not want to bloat the product.
Building on the modular architecture I developed earlier, I proposed optional integrations that would allow operators to extend their NMS with capabilities relevant to their specific needs without burdening everyone else with additional complexity.
Along the way, I helped the team manage USTDA grants, build out pilot sites in the DRC+FSM, and more!
Alongside the NMS, I supported broader initiatives that helped move Ukama’s network deployments forward, including coordinating USTDA grant work, wrangling MOUs from the local DRC government, and supporting the development of pilot sites in FSM. I also spearheaded mobile money and data-sharing integrations, helping establish the software foundations for future market expansion.
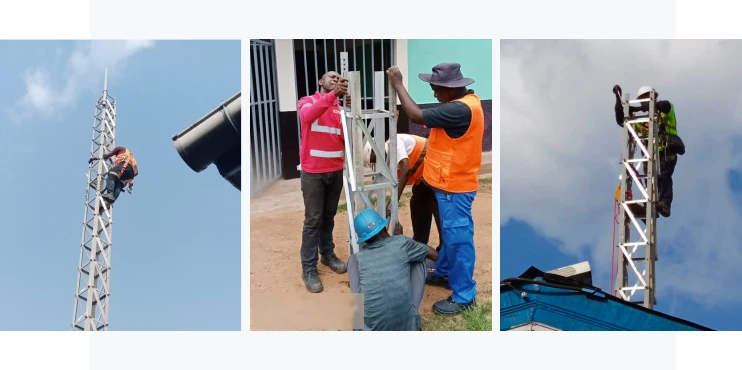
While hardware delays pushed the product's release beyond my time on the project, the validated solution was adopted as the corresponding software side of the solution.
While I didn’t get to see the NMS deployed at scale, the design direction was validated through internal testing and adopted as the software foundation for Ukama’s network management offering.
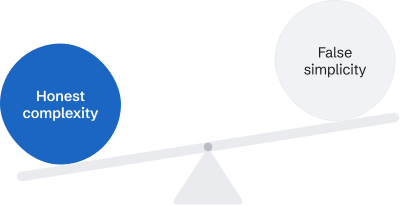
More importantly, this project fundamentally shaped how I approach unfamiliar, technically complex domains. I learned that making a system easier to use doesn’t necessarily mean stripping away its complexity. It means understanding how its pieces relate, identifying what matters most to the people interacting with it, and translating those relationships into something they can understand and act on.
Were I to approach this project today, I would create state machines to make testing every single edge case more efficient.